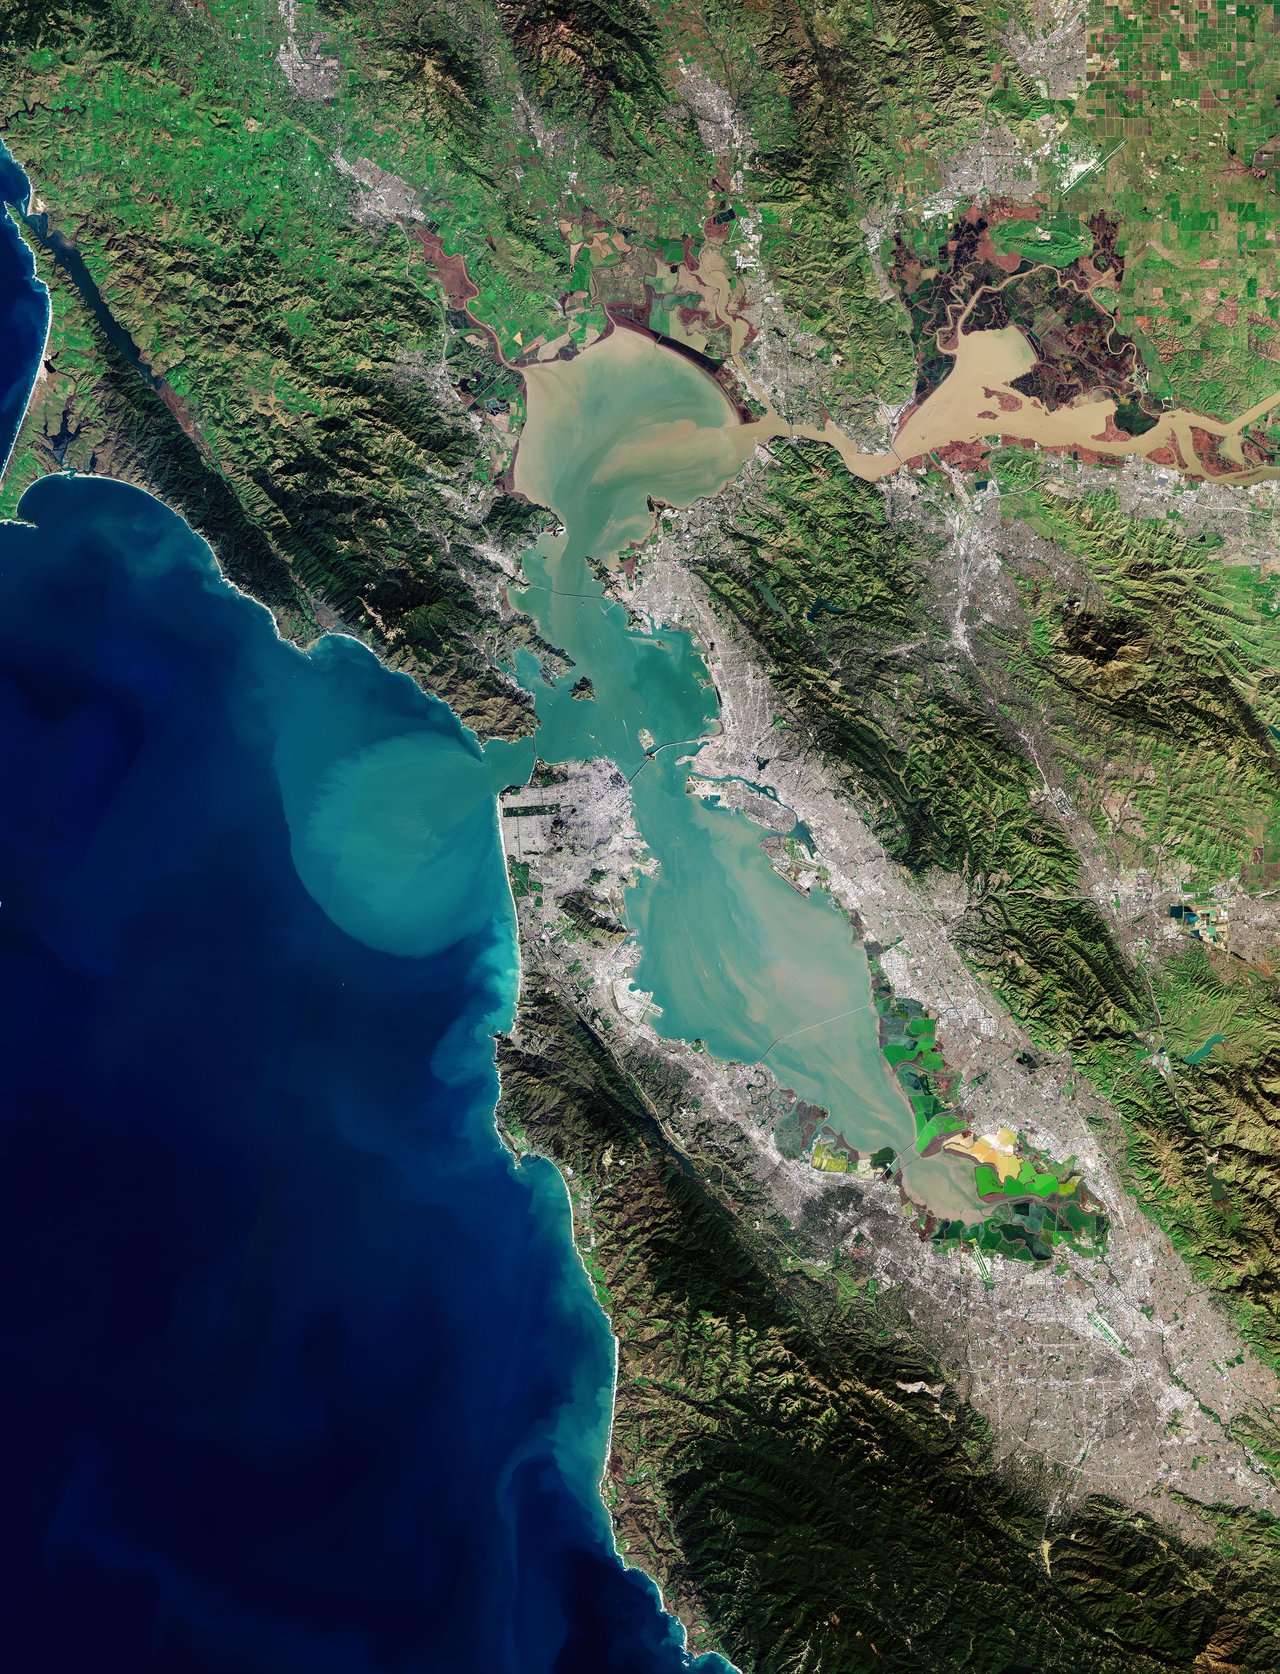
“How competitive is the housing market out there right now” is something everyone likes to discuss. My first answer is, it depends enormously on which specific city in the Bay Area you are interested in and what price point you are asking about. A market that is intensely competitive in one Bay Area city can be balanced just a few miles away. Here is the real, current data zone by zone in the Bay Area corridor (San Francisco through San Jose), rather than a single misleading regional average.
Before the data, a quick note on how to read it. Days on market tells you how quickly homes are going under contract, shorter generally means more competition. Sale to list price ratio tells you whether homes are selling above, at, or below asking price, and a ratio above 100 percent signals multiple offers are common. Offer counts, when available, give you a direct sense of how many buyers are typically competing against on a given property.
San Francisco has been the most dramatic competitive story in the Bay Area through 2026, and the pace of change within the year is itself worth noting. Earlier in 2026, Redfin's tracked data for the three months ending May showed homes selling in a median of about 14 days, receiving an average of 4 offers, with the average home selling around 16 percent above list price and hot properties reaching as much as 32 percent above list. At the luxury end specifically, the typical high end San Francisco home was going under contract in just 12 days, with nearly two thirds of luxury homes selling within two weeks.
As of the three months ending August 2026, the market has eased somewhat but remains firmly seller-favored. Homes are now selling in a median of about 19 to 20 days, roughly five to six days slower than the spring snapshot, with the sale to list ratio at 114 percent. Average homes are selling around 14 percent above list, and hot homes around 29 percent above list, going pending in about 12 days.
This is a meaningful shift in a short window, and it is a useful reminder for buyers: San Francisco in particular can move from extremely tight to still-tight-but-more-breathing-room within a matter of months. Buyers targeting San Francisco, particularly at higher price points, should still expect to compete against multiple offers on well priced, well presented listings, but the frenzy of spring 2026 has cooled slightly heading into fall.
The Peninsula is often talked about as one market, but "competitive" looks different depending on which city you're in. Here's the current picture, city by city.
Burlingame. As of the three months ending August 2026, homes in Burlingame are selling in a median of 14 days, with a sale to list ratio of 107.4 percent. Average homes are selling about 7 percent above list, and hot homes about 16 percent above list, going pending in 9 days. Burlingame remains a seller-favored market with room for buyers who are prepared and decisive.
San Mateo. San Mateo is currently running slightly tighter than Burlingame. As of the three months ending August 2026, homes are selling in a median of 14 days, with a sale to list ratio of 105.7 percent and average homes selling about 5 percent above list. Hot homes go about 13 percent above list, pending in 8 days.
San Carlos. At the neighborhood level, San Carlos is holding a similar pace to its Peninsula neighbors. Homes in the Devonshire neighborhood are selling in around 12.5 days, and El Sereno in around 12 days, both reflecting a market where well priced, well presented homes continue to move quickly.
San Bruno. San Bruno remains one of the more active Peninsula markets, with recent data showing homes selling in as little as 9 days and a sale to list ratio above 110 percent, with nearly 8 in 10 homes selling above asking. This is a market where buyers should be ready to move quickly on the right property.
Millbrae. Millbrae's tightest pockets are moving fast — neighborhoods like Mills Estates and Millbrae Meadows are both scoring among the most competitive in the Bay Area, with homes in the 14 to 15 day range. Buyers targeting Millbrae should expect the same level of preparation required elsewhere on the Peninsula.
Across all five cities, the pattern is consistent: the Peninsula isn't seeing the dramatic swings of San Francisco or the cooling seen in parts of San Jose. It's a steady, competitive market where the advantage still goes to buyers who show up prepared.
Silicon Valley cities have shown some of the most consistently fast selling paces in the entire Bay Area, though even here the pace has shifted since earlier in the year.
Cupertino, driven by extremely limited supply, was earlier in 2026 showing homes selling in as little as 7 to 15 days depending on the specific month and source. As of the three months ending August 2026, Cupertino homes are selling in a median of 14 to 16 days, still "very competitive," but no longer touching the 7-day pace seen at its tightest point earlier in the year. The market here has cooled modestly rather than dramatically, and Cupertino remains one of the tightest markets in the South Bay.
Mountain View has been harder to pin down with a single, reliable citywide figure, since several nearby cities and neighborhoods share the "Mountain View" name and inconsistent data has circulated. The clearest current read comes from Monta Loma, a Mountain View neighborhood in the 94043 zip code: homes there sold in a median of 14 days over the three months ending March 2026, up from 9 days the year before, still ranked "most competitive." That suggests Mountain View has likely followed the same modest-cooling pattern as Cupertino and Palo Alto, moving from an extremely fast pace to a still-fast one, though I was not able to confirm a clean citywide figure and would recommend verifying directly before publishing a specific day count for Mountain View as a whole.
Palo Alto has generally run a slightly more measured 12 to 14 days, still fast, but with somewhat more breathing room than the tightest South Bay pockets, and current data confirms this pace holding steady.
Cupertino specifically continues to stand out as one of the tightest markets in this entire report, a function of both strong demand and a housing stock that is largely built out, leaving very little new supply to ease the competition.
San Jose's competitiveness has varied more than other zones through 2026, and it also varies significantly by specific neighborhood. Citywide, the market has cooled since earlier in the year: as of the three months ending August 2026, homes are selling in a median of 21 days, with a 101.5 percent sale to list ratio and a "somewhat competitive" score, compared to the roughly 10 to 13 day pace seen earlier in the year amid a broader price reset. Within specific neighborhoods, Willow Glen and Cambrian Park have consistently ranked among the most competitive, selling within 9 to 10 days, while more accessible neighborhoods like Evergreen and Santa Teresa continue to show somewhat longer, though still reasonably brisk, selling timelines, with Santa Teresa currently at 21 days and Evergreen around 16 days.
San Jose currently offers the most variation in competitiveness of any zone in this report, and the citywide cooling trend makes that neighborhood-level variation even more important to account for, meaning your specific target neighborhood matters more here than in almost any other part of the Bay Area.
These figures move month to month, and this table reflects data gathered in mid 2026. Verify current days on market and sale to list ratios against live MLS data for your specific target neighborhood before making an offer strategy decision.
In the most competitive segments covered here, San Francisco’s luxury market, Cupertino, and San Jose’s Willow Glen and Cambrian Park pockets, buyers should expect to compete against multiple offers on well priced properties and should have a fully underwritten pre approval and a clean, well structured offer ready before touring, not after finding a home you love.
In the more moderately competitive segments, San Jose’s Evergreen and Santa Teresa neighborhoods in particular, buyers currently have somewhat more room to negotiate, request repairs, or take a more measured approach without necessarily losing out to a competing offer.
Across every zone in this report, well priced and well presented homes are moving quickly. The single biggest competitive advantage available to buyers in any of these markets is having a strong, verified pre approval and being ready to move decisively when the right property appears, rather than trying to negotiate aggressively on price in a market that is, across nearly every zone covered here, still favoring sellers on well positioned listings.
Which Bay Area zone currently offers buyers the most negotiating room? Based on current data, San Jose’s more accessible neighborhoods, Evergreen and Santa Teresa in particular, currently show the most room relative to the other zones and neighborhoods covered in this report, though “most negotiating room” here still means a competitive market by national standards.
Is San Francisco’s current competitiveness sustainable? This is uncertain, since it is closely tied to AI industry hiring and compensation trends that could shift. I would not assume current conditions are permanent, and I would recommend checking current data at the time you are actively searching.
Does a high sale to list ratio always mean I should offer well above asking? Not automatically. It means well priced, well presented homes in that specific market are attracting competitive offers, but every individual listing should be evaluated on its own merits, condition, and specific comparable sales, not just the broader zone average.
How often should I check this kind of competitiveness data while I am actively searching? I would recommend checking current data at least monthly during an active search, since these figures shift, sometimes from month to month, particularly in lower volume neighborhoods.
Zone level competitiveness data is a useful starting point, but the right offer strategy for you depends on the specific property, neighborhood, and current conditions at the moment you are ready to make an offer. I track these markets closely and would be happy to give you the current comparison of your specific target.
Jacklyn O’Connor Friedland
Serving San Francisco, the Peninsula, Silicon Valley, San Jose, and the full Bay Area corridor.
Compass | Burlingame, CA
(650) 766 0791. | jacklynfriedland.com
CA DRE# 01726418
This article is for informational purposes only. Days on market, sale to list ratios, and competitiveness figures are drawn from Redfin data as of September 2026 and represent general zone and neighborhood level conditions, which have shown real movement within just the past few months, particularly in San Francisco, Cupertino, and San Jose. Verify current market data against live MLS listings before making an offer strategy decision. Contact a licensed real estate professional for guidance specific to your situation.
Redfin. "San Francisco Housing Market" (three months ending May 2026 and three months ending August 2026 data). Accessed September 22, 2026. redfin.com/city/17151/CA/San-Francisco/housing-market
Redfin. "Cupertino Housing Market" (three months ending August 2026). Accessed September 22, 2026. redfin.com/city/4561/CA/Cupertino/housing-market
Redfin. "Monta Loma, Mountain View Housing Market" (three months ending March 2026). Accessed September 22, 2026. redfin.com/neighborhood/11333/CA/Mountain-View/Monta-Loma/housing-market
Redfin. "Palo Alto Housing Market" (three months ending August 2026). Accessed September 22, 2026. redfin.com/city/14325/CA/Palo-Alto/housing-market
Redfin. "San Jose Housing Market" (three months ending August 2026). Accessed September 22, 2026. redfin.com/city/17420/CA/San-Jose/housing-market
Redfin. "Santa Teresa, San Jose Housing Market." Accessed September 22, 2026. redfin.com/neighborhood/9861/CA/San-Jose/Santa-Teresa/housing-market
Redfin. "Willow Glen, San Jose Housing Market" (March 2026 data). Accessed September 22, 2026. redfin.com/neighborhood/58427/CA/San-Jose/Willow-Glen/housing-market
Block Change Real Estate. "San Jose Real Estate Market 2026 - Evergreen San Jose Housing Market," citing Redfin data (March 2026). Accessed September 22, 2026. blockchangere.com/blog/rates-fell-san-jose-didnt-slow-down-the-2026-evergreen-and-silver-creek-playbook
Redfin. "Burlingame Housing Market" (three months ending August 2026). Accessed September 22, 2026. redfin.com/city/2350/CA/Burlingame/housing-market
Redfin. "San Mateo Housing Market" (three months ending August 2026). Accessed September 22, 2026. redfin.com/city/17490/CA/San-Mateo/housing-market
Redfin. "Devonshire, San Carlos Housing Market." Accessed September 22, 2026. redfin.com/neighborhood/14129/CA/San-Carlos/Devonshire/housing-market
Redfin. "El Sereno, San Carlos Housing Market" (three months ending June 2026). Accessed September 22, 2026. redfin.com/neighborhood/63788/CA/San-Carlos/El-Sereno/housing-market
Houzeo. "San Bruno, CA Housing Market in 2026," citing Redfin data (March 2026). Accessed September 22, 2026. houzeo.com/housing-market/california/san-bruno
Redfin. "Mills Estates, Millbrae Housing Market" (three months ending March 2026). Accessed September 22, 2026. redfin.com/neighborhood/11411/CA/Millbrae/Mills-Estates/housing-market
Redfin. "Millbrae Meadows, Millbrae Housing Market" (three months ending May 2026). Accessed September 22, 2026. redfin.com/neighborhood/547114/CA/Millbrae/Millbrae-Meadows/housing-market
As a trusted Realtor to the San Francisco 49ers and Oakland Raiders organizations, her expertise handling housing for a long list of professional athletes and coaches is proven and trusted.
Let's ConnectBuying, selling, or relocating to the Bay Area? From early access to new listings to expert guidance on pricing and marketing your home, I cover the full corridor from San Francisco, through the Peninsula and Silicon Valley, down to San Jose.

Compass
988 Howard Ave., Suite 300, Burlingame, CA 94010 CA DRE# 01726418